Hourly listing prices · 1 year+ history
Historical CS2 Price Data & API
CSPriceAPI records the listing price of every CS2 skin roughly every hour and keeps 1+ year of daily history on top. See the full price trend on any skin's detail page, or pull the entire time series programmatically for charting, backtesting and portfolio analytics.
- Resolution
- hourly prices
- Depth
- 1 year+
- Markets
- 13 marketplaces
- Format
- JSON REST API
Real API data
Price history from every market, with real data
Daily prices of one item over the last 30 days from GET /v1/prices/{market}/history, in each market's native currency. The API keeps 1 year or more. This page refreshes every 30 minutes.
market_hash_name
AK-47 | Redline (Field-Tested)
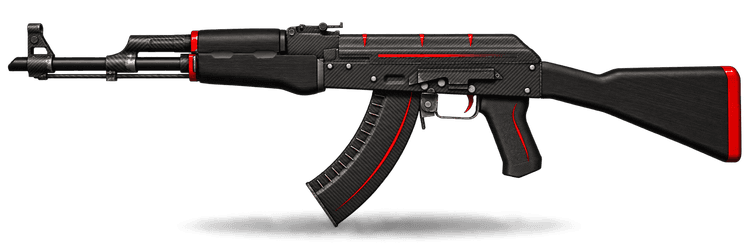
/v1/prices/youpin/historyEnterpriseDaily prices going back 1 year or more. The chart shows the last 30 days.
Price history
90-day price trends from real data
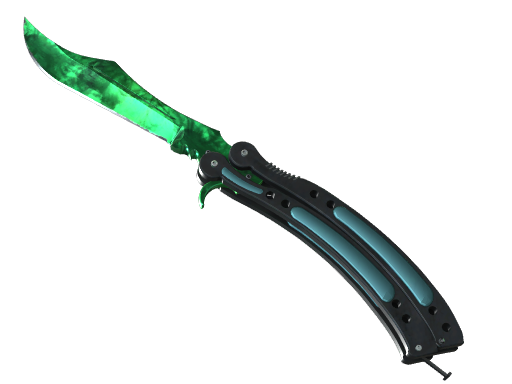
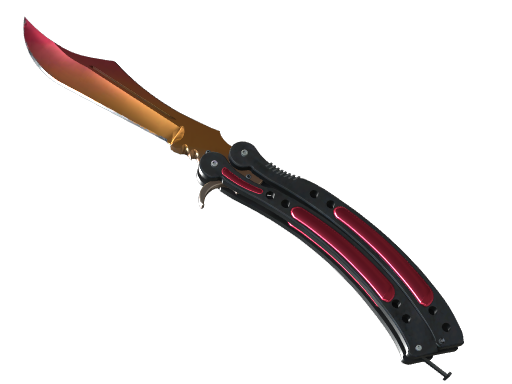
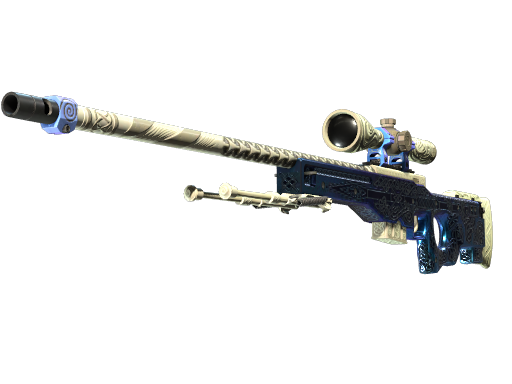
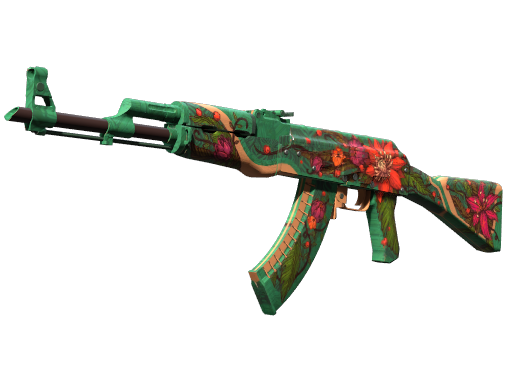
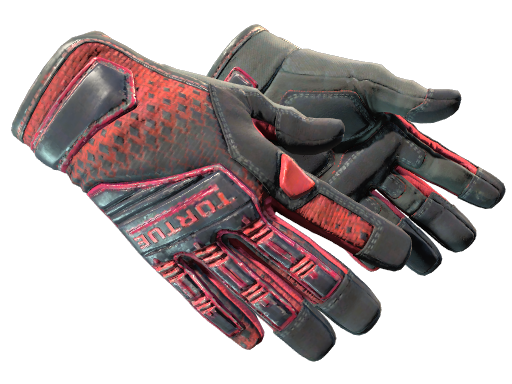
Each spark is built from stored daily closes on YouPin. Open any skin for the full interactive chart with per-market overlays.

About
What is historical price data?
Historical price data is the full time series of a skin's market price — not just what it costs today, but what it cost last week, last month and a year ago. CSPriceAPI samples listing prices roughly every hour and consolidates them into daily closes for long-range analysis.
This is the same data that powers the interactive charts on every skin detail page. Traders use it to spot trends, time entries and exits, backtest strategies and track portfolio performance over time.
What you get
Inside the history feed
- Hourly listing pricesIntraday resolution captured across the day.
- Daily closesRolled-up daily points for clean long-range charts.
- Per-market historyYouPin, BUFF163, Skinport, SkinBaron, CSFloat & more.
- 1 year+ depthDaily history going back 1 year or more.
Why it matters
Built for charts & analytics
- Hourly resolution
- Listing prices sampled roughly every hour so you catch intraday moves, not just end-of-day snapshots.
- Trend & backtesting
- 1+ year of daily history is ready for moving averages, backtests and long-range trend analysis.
- Per-market series
- Compare how the same skin was priced on YouPin, BUFF163, Skinport and other markets over time.
- Chart-ready JSON
- Time series shaped for plotting libraries — timestamps and prices, no scraping or clean-up needed.
- Portfolio tracking
- Value inventories over time and measure realized and unrealized performance from real market data.
- One key, all markets
- One API key covers every endpoint your plan includes: live prices, buy orders, float-ranged data and history.
Developer API
Historical Data REST API
Pull price history for any skin as JSON — use resolution=hourly for intraday charts (up to ~100 days) or resolution=daily for backtests over 1+ year across every supported market.
- GET
/v1/prices/youpin/history?resolution=daily - GET
/v1/prices/youpin/history?resolution=hourly - GET
/v1/prices/buff163/history?resolution=daily
curl -s "https://api.cspriceapi.com/v1/prices/youpin/history?market_hash_name=AK-47%20%7C%20Redline%20(Field-Tested)&resolution=daily" \
  -H "x-api-key: YOUR_API_KEY"
How to get historical CS2 skin prices
Historical data answers: where was this skin priced last month, last year, on YouPin vs Skinport? CSPriceAPI stores hourly and daily price history per marketplace and shows interactive charts on every skin detail page for free.
REST API — per-market history
curl -s "https://api.cspriceapi.com/v1/prices/youpin/history?market_hash_name=AK-47%20%7C%20Redline%20(Field-Tested)" \
  -H "x-api-key: YOUR_API_KEY"
Replace youpin with buff163, skinport, skinbaron, csfloat, market-csgo, etc.
Interactive docs: GET /v1/prices/{market}/history.
Web charts (no API key)
Every skin in Browse Skins has a price-history chart with per-market overlays. Open any item → scroll to the chart section.
Hourly vs daily
Use the resolution query parameter on the same endpoint:
| Resolution | Best for | Range |
|---|---|---|
hourly | Intraday charts, short-term moves | Up to ~100 days per request |
daily (default) | Long-range trends (1 year+), backtests | Full stored history |
# Intraday (hourly listing snapshots)
curl -s "https://api.cspriceapi.com/v1/prices/youpin/history?market_hash_name=AK-47%20%7C%20Redline%20(Field-Tested)&resolution=hourly" \
  -H "x-api-key: YOUR_API_KEY"

# 1 year+ (daily closes)
curl -s "https://api.cspriceapi.com/v1/prices/youpin/history?market_hash_name=AK-47%20%7C%20Redline%20(Field-Tested)&resolution=daily" \
  -H "x-api-key: YOUR_API_KEY"
Listing prices are captured roughly every hour; daily points roll those up for long-range charts.
The dedicated Historical Data product serves this history one skin per request (Enterprise) for backtesting and portfolio analytics.
Use cases
| Job | Approach |
|---|---|
| Trend chart on a dashboard | /v1/prices/{market}/history + your chart library |
| Backtesting a strategy | Daily series + fee model; watch for survivorship bias |
| Portfolio P&L over time | History + acquisition cost from your ledger |
| Spotting manipulation | Cross-check listing history vs sales data |
Related endpoints
GET /v1/market-sales/search— completed sales by item nameGET /v1/prices/latest— current snapshot to anchor the latest point
FAQ
Historical data questions answered
What is CS2 historical price data?
Historical price data is the recorded time series of a Counter-Strike 2 skin's market price. CSPriceAPI stores hourly listing prices and keeps 1+ year of daily history, so you can see exactly how a skin's value moved over time instead of just its current price.
How often are historical prices recorded?
Listing prices are captured roughly every hour. Those hourly points are rolled up into daily closes for long-range charts, so both short-term intraday movement and trends over the past year and more are available.
Which markets does the price history cover?
History is tracked across all supported marketplaces — YouPin (YouPin898), BUFF163, Skinport, SkinBaron, CSFloat and more — so you can compare how the same skin was priced on different markets over time.
Can I access historical data through an API?
Yes. The Historical Data package exposes full price history per skin as JSON over a REST endpoint, authenticated with an API key in the x-api-key header. It's built for charting, backtesting and portfolio analytics.
How far back does the price history go?
We hold 1+ year of daily history for every covered market, in addition to the recent hourly detail. For items added more recently, history starts when tracking began.
Where can I see the historical charts for free?
Every skin detail page includes an interactive price-history chart with per-market overlays. Browse any skin to explore its full listing-price trend at no cost.
Every endpoint, every market
Try the API free for 2 days
A test key gives access to listing prices, buy orders, history and sales data. Paid plans start at $50/month.
Get a test key on DiscordOr read the quickstart and pricing.